This is the first in a series of three articles exploring how we can improve the odds for our strategic investments by Quantifying Our Stories in Scenarios . . .
- Step 1: For Future Events
- Step 2: For Long-Term Cashflow
- Step 3: For Long-Term Cashflow Expectations at Earlier Horizons
How can quantified scenarios for future events help us all improve our decisions?
Our long-term results will be the sum of our results from many decisions whose outcome is impossible to predict with certainty. Some of these decisions will produce winning outcomes and some will produce losing outcomes, so improving our long-term results relies on increasing the number of winning outcomes and their respective amounts and reducing the number of losing outcomes and their respective amounts.
Thanks to that simple math, even though we cannot predict each outcome with certainty, we can all improve our long-term results by predicting the odds of each outcome.
Billionaire investor Charlie Munger said it well 25 years ago:
If you don't get this elementary, but mildly unnatural, mathematics of elementary probability into your repertoire, then you go through a long life like a one-legged man in an ass-kicking contest.
How can stories help us all produce better quantified scenarios for future events?
Statistics from the past offer a good start, since past odds are observable as frequencies, and many events do repeat, like sunrise and sunset. Old statistical methods like regression analysis can help us extrapolate some of these repeat patterns, and newer methods like deep neural networks can help us extrapolate even more of them. We can all leverage the latest statistical methods with support from leading data science service providers like Two Six Capital.
But billionaire investor Ray Dalio discourages us from extrapolating past data blindly:
The main thrust of machine learning in recent years has gone in the direction of data mining, in which powerful computers ingest massive amounts of data and look for patterns. While this approach is popular, it’s risky in cases when the future might be different than the past. Investment systems built on machine learning that is not accompanied by deep understanding are dangerous because when some decision rule is widely believed, it becomes widely used, which affects the price. In other words, the value of a widely known insight disappears over time. Without deep understanding, you won’t know if what happened in the past is genuinely of value and, even if it was, you will not be able to know whether or not its value has disappeared—or worse. It’s common for some decision rules to become so popular that they push the price far enough that it becomes smarter to do the opposite.
On the other hand, in his 2011 New York Times best seller Thinking, Fast and Slow, Economics Nobel Laureate Daniel Kahneman warns us that the fast intuition that Malcolm Gladwell described in his 2007 bestseller Blink is not effective at conceiving statistics for a changing future and that we must develop newer, slower habits of mind to do so.
So are we between a rock and a hard place?
Fortunately, in 2015 Kahneman offered us all some encouragement by writing the forward to the best seller Superforecasting: The Art and Science of Prediction. Its author, University of Pennsylvania Psychology Professor Philip Tetlock, had coined the phrase “The average expert was roughly as accurate as a dart-throwing chimpanzee” in his 2006 book Expert Political Judgment: How Good Is It? How Can We Know? However, in this 2015 book, he encourages us that we can indeed improve our future statistics by supplementing past data with Dalio’s human “deep understanding” through stories:
I realized that as word of my work spread, its apparent meaning was mutating. What my research had shown was that the average expert had done little better than guessing . . . But debunkers go too far when they dismiss all forecasting as a fool’s errand. I believe it is possible to see into the future, at least in some situations and to some extent, and that any intelligent, open-minded, and hardworking person can cultivate the requisite skills.
And Tetlock’s team proved this in its Good Judgment Project, which calculated a Brier score for explicit odds forecasts by over 20,000 people for over 500 future events requested by the CIA’s research arm. It found that the best group of people were 66% more accurate than random guesses through disciplined quantification of news stories in scenarios. Take that, dart-throwing chimpanzees!
Tetlock offers 10 best practices to join that best group. Notably, Tetlock’s advice there is reinforced by none other than Ray Dalio, whose 2018 best-seller Principles recommends 11 similar best practices for decision-making.
Bullet Point Network serves a client base of elite managers and investors who apply these best practices. They complement their deep domain expertise and extensive research by using our team and software to Quantify Stories in Scenarios through 3 steps.
Below, we illustrate Step 1, using the Bullet Point Network Platform to apply each of Dalio’s 11 best practices while Quantifying Stories in Scenarios for a future event involving a fictitious company that we call virtualgoods.shop. Any resemblance to actual companies, living or dead, or actual events is purely coincidental:
1. Recognize that decision-making is a two-step process (first learning and then deciding)
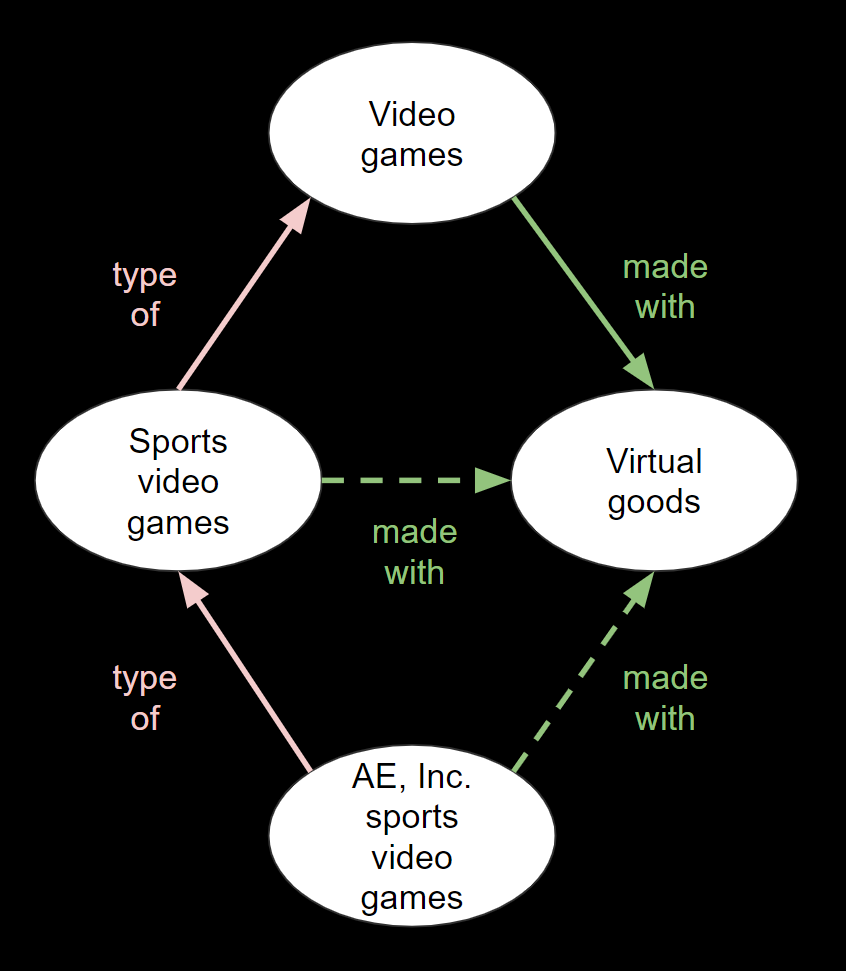
The Platform’s patented architecture includes a Logical Graphical Model that supports the learning step by helping us all connect excerpts from stories more scalably than we can with folders and tags, as well as a Probabilistic Graphical Model that supports the deciding step by helping us all translate those stories into explicit odds that we can weigh.
Logical Graphical Models use Description Logics to infer some qualitative relationships (the dotted lines) from others, helping us draw more connections between excerpts from stories.
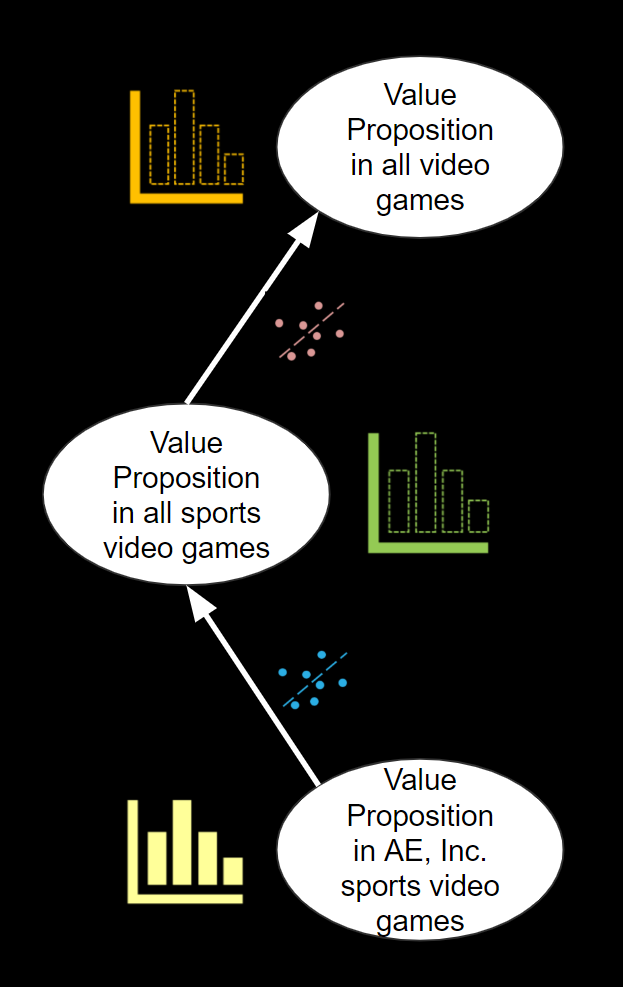
Probabilistic Graphical Models use Bayesian Statistics to infer odds of scenarios for some Issues (dotted green and orange) from scenarios for other Issues (yellow) and the conditionality between them (blue and red).
2. Synthesize the situation at hand
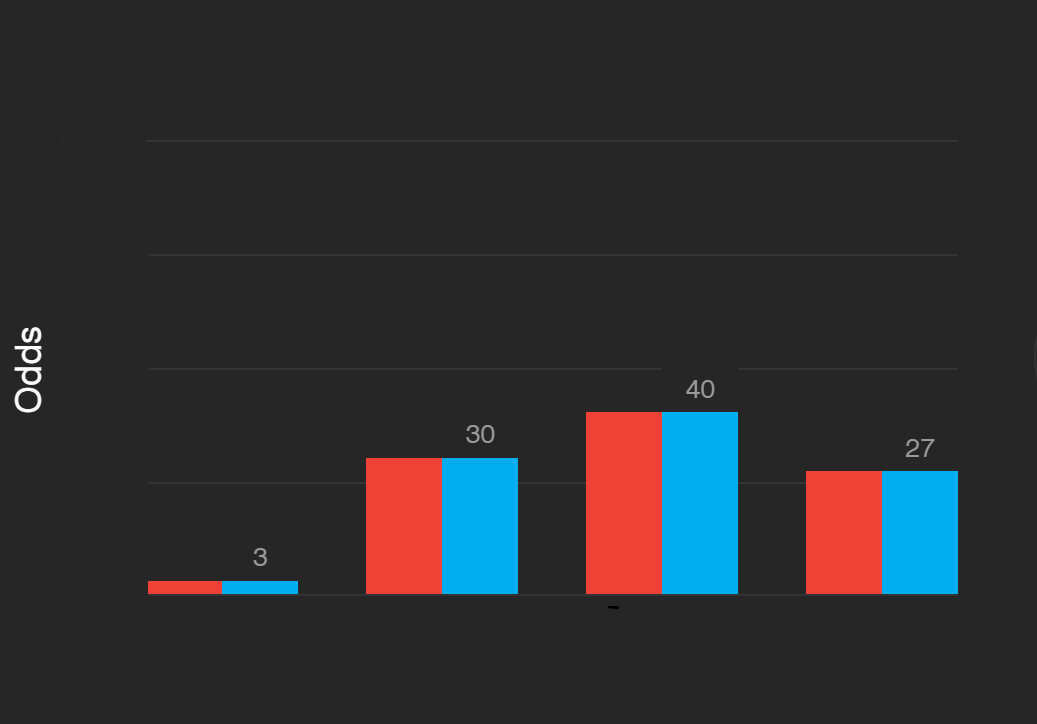
When we all identify an important event, like proving out the strength of virtualgoods.shop’s value proposition in its initial market, our Platform’s architecture encourages us all to synthesize data and stories about that event’s potential outcomes from multiple sources and to seek arguments in favor of each of the potential outcomes in order to call their odds more accurately. We can see this below, where the argument from AE, Inc. may carry the most weight in our minds even though it is not the most recent.
3. Synthesize the situation over time
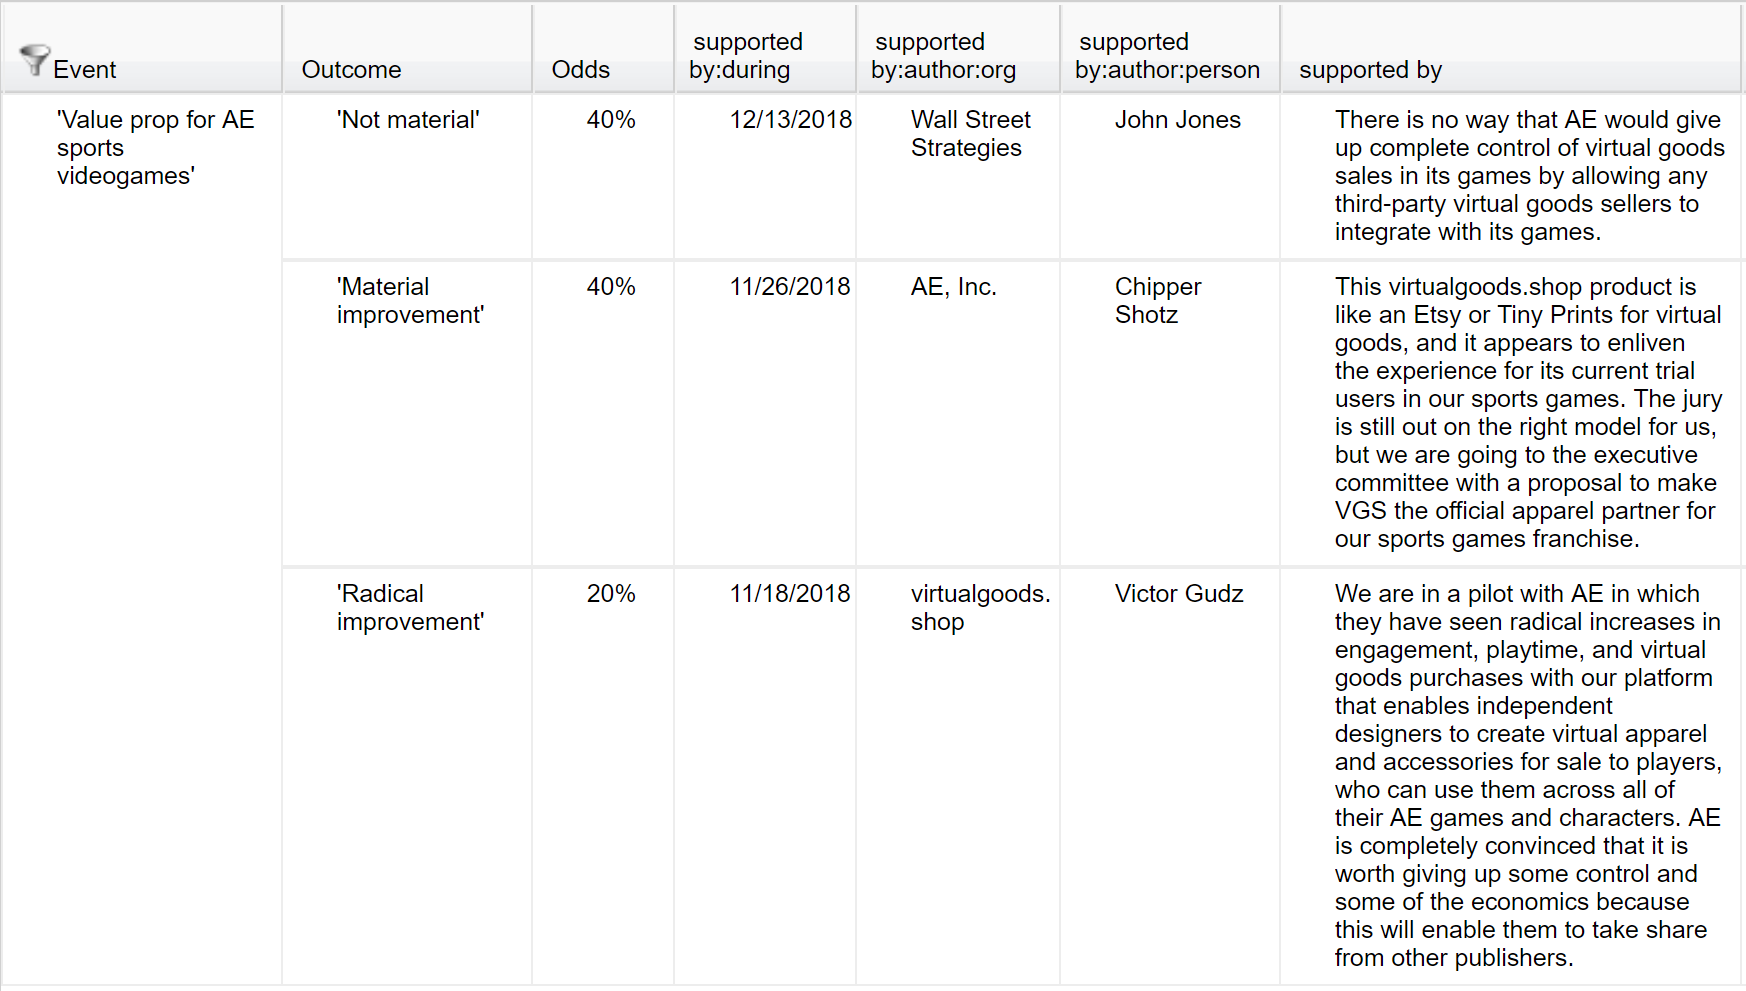
When we enter new excerpts from stories into the Bullet Point Network Platform, our collaborators who are permissioned for these excerpts can go to the BPN Feed and see at a glance how they compare to previous excerpts about the same outcome, so we can all change our odds for that outcome incrementally over time, as Tetlock also advises:
4. Navigate levels effectively
Perhaps what we really want to call the odds for is virtualgoods.shop’s peak annual revenue. But to do that, Tetlock advises us to emulate Manhattan Project physicist Enrico Fermi and break peak revenue down successively into what he calls “tractable sub-problems,” such as revenue by market, market share by market, and value proposition by market. As Tetlock says:
The surprise is how often remarkably good probability estimates arise from a remarkably crude series of assumptions and guesstimates.
Our Platform’s graph structure and multiple dimensions make navigating levels more practical for all of us than it is with slides, memos, and spreadsheets:

5. Logic, reason, and common sense are your best tools for synthesizing reality and understanding what to do about it
In the table above, we can see that we do not need some extravagant extrapolation of past statistics in order to handicap many scenarios for peak revenue. Instead, we can do so just by applying logic to what might produce those revenues, such as what might be the number of videogame players in the future and what each might spend on virtual goods, and what percentage via virtualgoods.shop and at what commission rate.
Those are issues for which we can all apply common sense. Especially if we are teenagers or live with some, we can notice when any scenarios portray unrealistic behavior by gamers, even far into the future.
We can also imagine future changes that past statistics alone may not suggest. The late Stanford Investors Professor of Finance Jack McDonald surprised his 1999 MBA investment class on its first day by handing out a newspaper review of the third book in the Harry Potter series, which had been published recently. As his students puzzled over why this was their first handout in an investment class, he challenged them to imagine how big J.K. Rowling could make the Harry Potter franchise. As it turns out, of course, it became so much bigger than the three best-selling children’s books that it was at that time, big as that seemed already. Past statistics did not suggest what Professor McDonald’s imagination did.
6. Make your decisions as expected value calculations
Many business people make decisions based on slides, memos, and spreadsheets that only portray the most-likely case, and perhaps some lip-service to something arbitrarily higher or lower than it. However, the most-likely case is often not representative of the cumulative results of numerous decisions over the long-term. By making it more practical for us to sketch out more scenarios, our Platform helps us see the mean across them so we can make decisions that are more strategic:
7. Prioritize by weighting the value of additional information against the cost of not deciding
One challenge in research is how much to do. We should certainly understand the potential size of relevant market segments as well as the current competitive landscape, but how much time and money should we spend looking into virtualgoods.shop’s value proposition in its first target market, sports videogames published by AE, Inc?
That can depend on how much learning virtualgoods.shop’s value proposition in its first market may influence our odds for its value proposition in broader markets that may take longer to prove out, like all sports videogames and even all videogames. It can also depend on how different categories of virtualgoods.shop’s value proposition, say “Not material” or “Material improvement” or “Radical improvement,” can influence our range for peak market share in each of those markets. By quantifying our research-driven human judgments on these, as Tetlock suggests, we can gain a clear perspective on how important virtualgoods.shop’s value proposition for AE sports videogames may be for its overall peak revenue.
If you would like to explore this perspective on the relationship between initial market value proposition in one chart below and peak revenue in the other chart, you can choose to drag the blue bars or type numbers that add to 100 above the blue bars. If you decide to share the odds that you drag or type, you can click Post Your Own Views below the chart, and then you will be invited to Sign Up to see premium content in the BPN Feed:
8. Simplify!
Some might protest that it is too hard to structure in this way everything that we write in a story like an investment memo. That’s right! And that’s the point. Long memos often lull managers and investors into a false sense of security by helping us all feel thorough but failing to connect many of the assertions in our memos clearly to their impact on scenarios for our results.
It is invaluable to force ourselves to apply the 80/20 rule to stories that we write about the future, structuring the minority of the information in them that is likely to influence the majority of our outcomes.
9. Use principles
At one Berkshire Hathaway annual meeting, Warren Buffett was asked whether he would rather hire someone with experience or with the right “latticework of mental models” described by his partner Charlie Munger in his famous 1994 speech, A Lesson on Elementary, Worldly Wisdom As It Relates to Investment Management & Business. Buffett replied that he would like both, of course, but if forced to choose, he would choose the right models over more experience, because we all learn much more from experience when we have the right latticework on which to hang it.
The “elementary, but mildly unnatural, mathematics of elementary probability” is just one of the mental models with which we can learn more from our experience. We must complement it with others. The blog Farnham Street provides a great menu of these.
10. Believability weight your decision making
Those familiar with investing in volatility via financial options may observe that widening our distributions of scenarios is not an adequate solution when our confidence is low, because it may motivate us to overpay for insurance.
Our Platform equips us with another solution, enabling us to assert our level of confidence in each of our judgments and to infer a measure of confidence in other distributions of scenarios implied by those judgments. We can judge our confidence in each judgment based on the quality of the supporting evidence that we have attached directly to it, including whether we have obtained enough information from sources that are believable enough.
Then we can wait to bet only on scenarios for which we have reached reasonable confidence.
11. Convert your principles into algorithms and have the computer make decisions alongside you
In the Bullet Point Network Platform, our team has spent years building scenario models for common phenomena that we all face as managers and investors. We will describe these in subsequent steps:
- Step 2: Curve Model and Integrated Financial Statements Model
- Step 3: Bi-Temporal Model of Future Horizons, Capital Markets Rates Model, and Future Multiples Model
- Bonus: Event Model
As Dalio emphasizes, when we make explicit in a computer model the future scenarios that we conceive, then we learn much more as the future unfolds.
And as Tetlock emphasizes, we can also measure our foresight over time, for example by calculating the percentage of the time the outcomes of events were below the explicit 90th percentile in our forecast from before the event occurred. If we were below our 90th percentile only 50% of the time, then we were too conservative on our upside cases, and if they were below 100% of the time, then we were too aggressive. Either way, misses like these catalyze learning and improving.
The Next Step
Quantifying Stories in Scenarios for future events is even more useful to our network of managers and investors when we also connect them to statistics for a company’s future cash flows. We illustrate how in our next article, Step 2: Quantify Stories in Scenarios for Long-Term Cashflow.