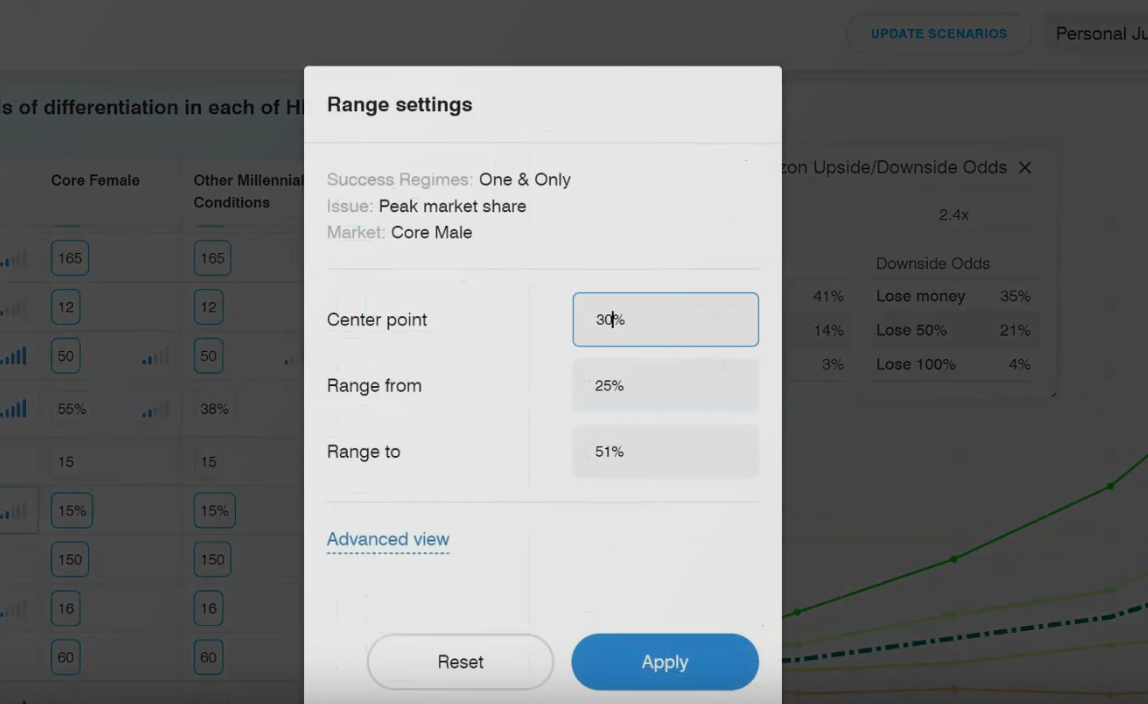
The BPN Platform integrates “Research Management” and “Scenario Modeling,” making it practical to Quantify Our Stories in Scenarios, starting by organizing data, research, and qualitative insight and ending with probabilistic scenarios based on logic rather than random Monte Carlo simulation.
We drive everything to integrated financial statements and produce interactive reporting so you can clearly see the upsides and downsides you are modeling.
Logical Graphs
and Probabilistic Graphs
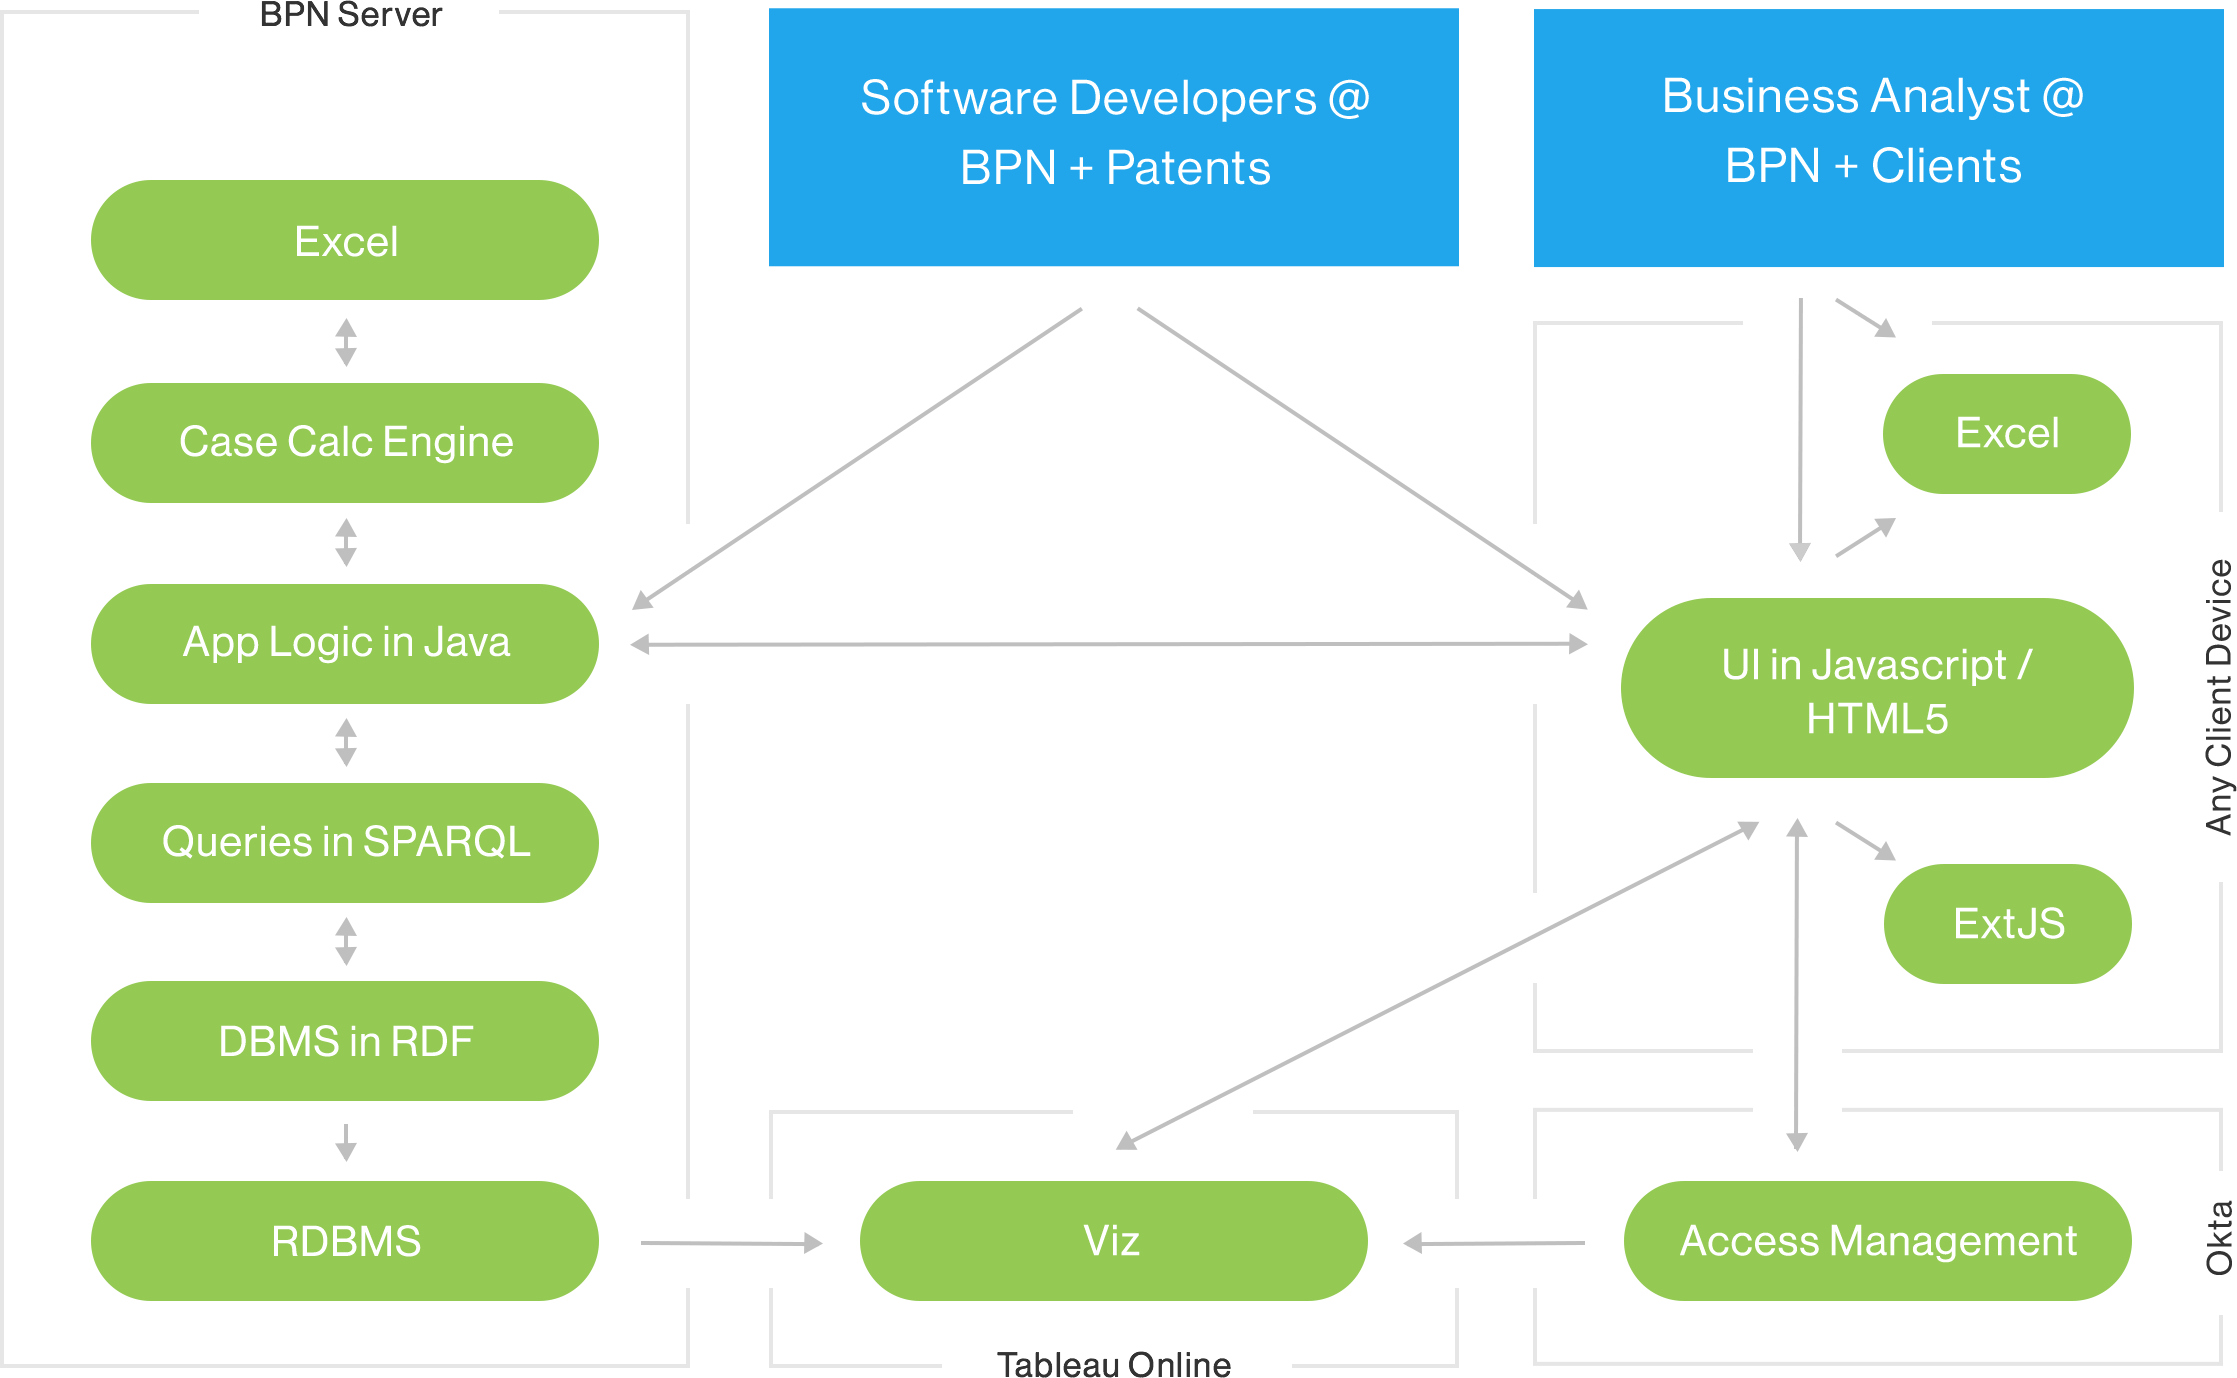
Thanks to 10 years of R&D funded by National Science Foundation grants and private investment, BPN produced a patented architecture that integrates two kinds of graphical models from separate fields of artificial intelligence.
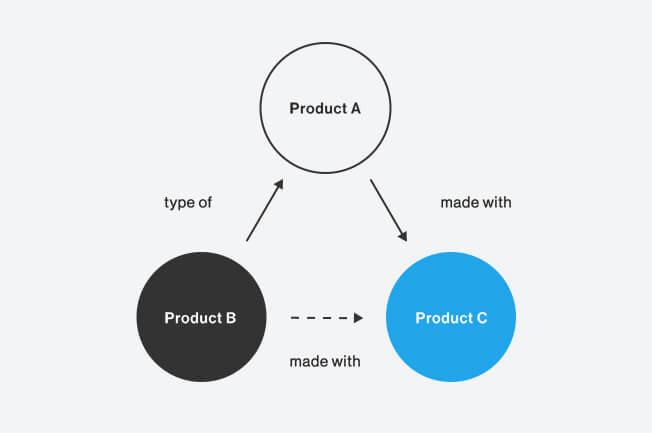
Logical Graphical Models infer some qualitative relationships (the dotted line) from others.
Our patented architecture makes it practical to use a Logical Graphical Model to organize stories about issues more scalably than with folders and tags and to translate them into a Probabilistic Graphical Model that produces many scenarios without writing stories for all of them. With this insight, leaders can make better decisions.
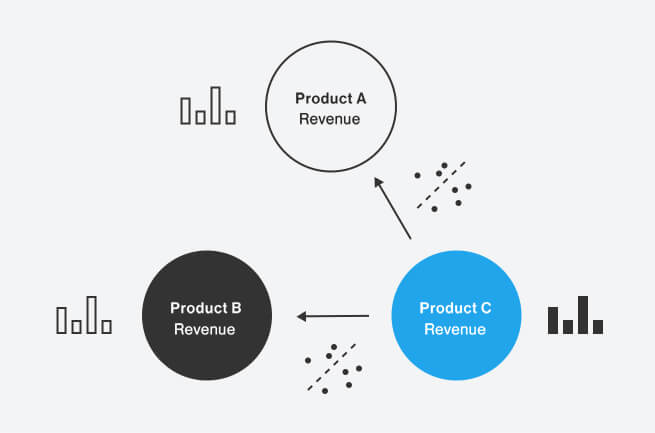
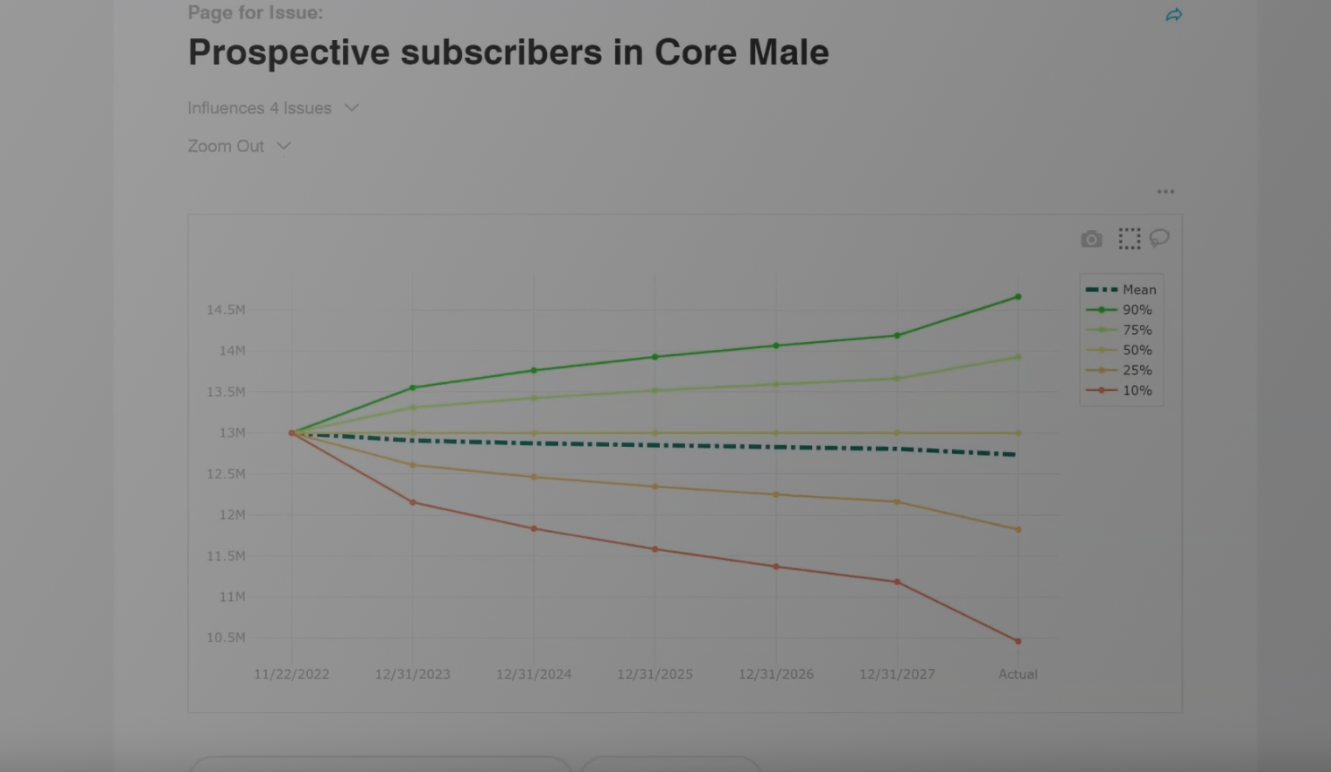
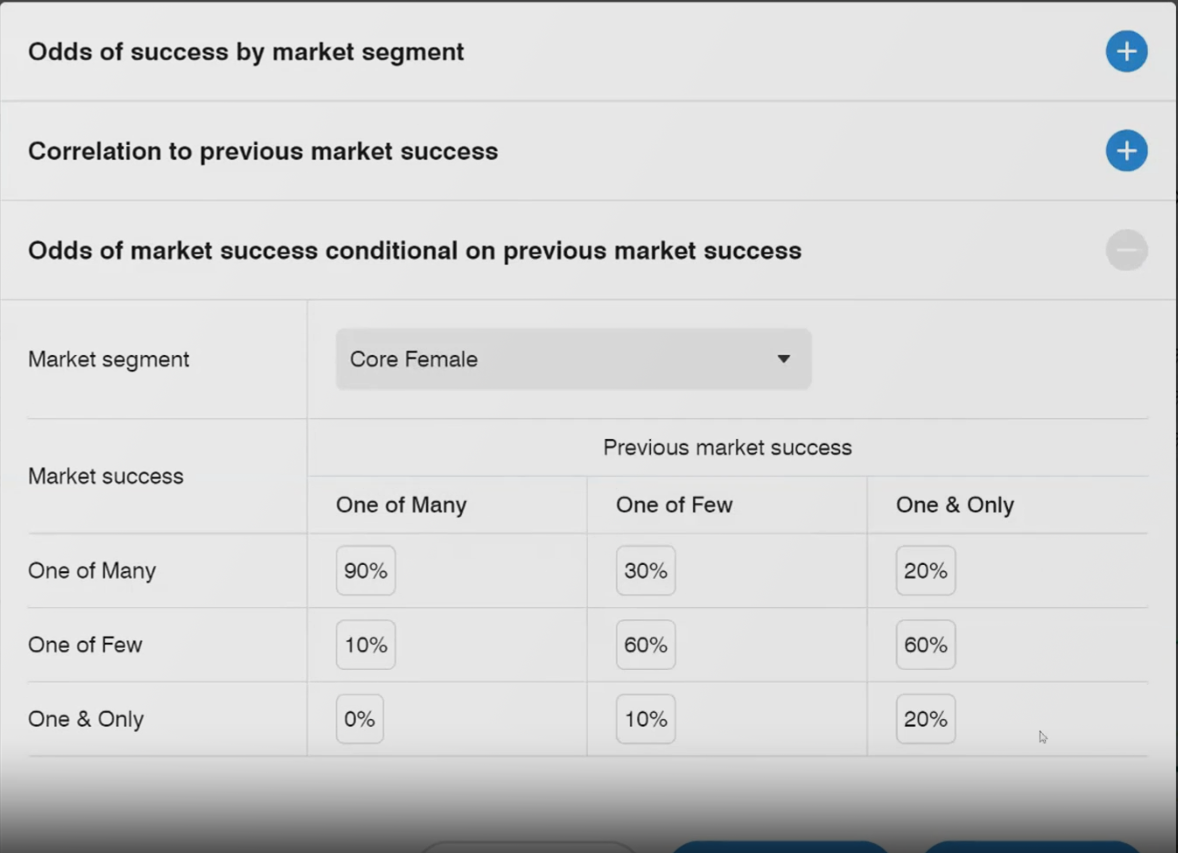
Probabilistic Graphical Models infer odds of scenarios for some Issues (the white bars) from scenarios for some other Issues (the black bars) and the conditionality between them (the scatter plots).
Leveraging our platform, our team has analyzed many public and private companies across industries. Here is one simplified example in the technology sector, based on five key drivers of expectations for the long-term profitability and value of an internet ad-driven business.
Using the Logical Graphical Model in the BPN platform, we attach research directly to key drivers of scenarios instead of losing the research in a sea of folders and tags:
The Probabilistic Graphical Model helps us model the influences one issue can have on another in order to produce realistic combinations for their impact on a strategic decision.
Below, you can see us exploring a potential tradeoff between the two key drivers of ads viewed per minute of use vs. minutes of use per day, dragging blue bars to change odds of scenarios for each driver and watching odds for the other change in response:
The BPN Platform also allows network users to drill, in either direction, from scenarios for one Issue to scenarios for other Issues that it influences or is influenced by.
By producing 100 realistic combinations of these key drivers, we produce 100 scenarios for future expectations for financial results and valuation of the stock.
Here is 1 scenario for expectations and valuation 2 years from now. Drag the dot at the bottom to explore any of the other 99 scenarios. If reading on a smartphone, flip to landscape mode first.
The Platform’s multi-dimensional architecture makes it practical to explore multiple horizons without duplicating stories and models.
Here, we summarize percentiles for this stock price not only 2 years from now, but also at the earlier horizons of this year-end and next year-end.
The Bullet Point Network Platform makes it practical for investors and portfolio companies to quantify their stories, driving strategic decisions with data science about not only the past, but also the future.
We’d love to show you the power of BPN’s graph technology and experienced research team.